You are here: Evaluating Data > Using the Spreadsheet View > Understanding Document Properties
Understanding Document Properties
Introduction
Factory defaults and user-default properties exist for Experiments, Spreadsheets, and Graphs. When TRIOS software is first installed on a computer, all of the properties will be set to the factory defaults, and the user defaults will be undefined. Continue to the sections below for an overview of setting properties for these three document views.
Back to top
Experiment, Spreadsheet, and Graph Document Properties
The Experiment document properties define colors and fonts for the Sample, Geometry, and Procedure bars. The Spreadsheets and Graphs documents contain variables and presentation properties, as do each object within a presentation. Presentation objects include fonts, backgrounds, axis tick marks – essentially everything about the document view (other than the variables).
A data file is created when an experiment starts. The display properties are the current user defaults, or factory defaults if the user defaults are undefined. Any changes made to the variables or presentation before the experiment completes are stored in the file. However, it is important to note that these changes do not modify the user defaults unless they are explicitly saved. Therefore, if a new experiment is started, the properties revert to the current defaults.
Things to consider when modifying document properties:
- If modifications are made to variables or presentation after the experiment is complete, the file will not be flagged as "unsaved," and you will not get a warning message to save changes. Only a change in the actual data will flag the file as "unsaved."
- Variables are stored per user and per procedure step type. Presentations are stored per user. A user is defined as a Windows® account which has a login name and password.
Variables and Presentation
Some notes on saving variables and presentation properties:
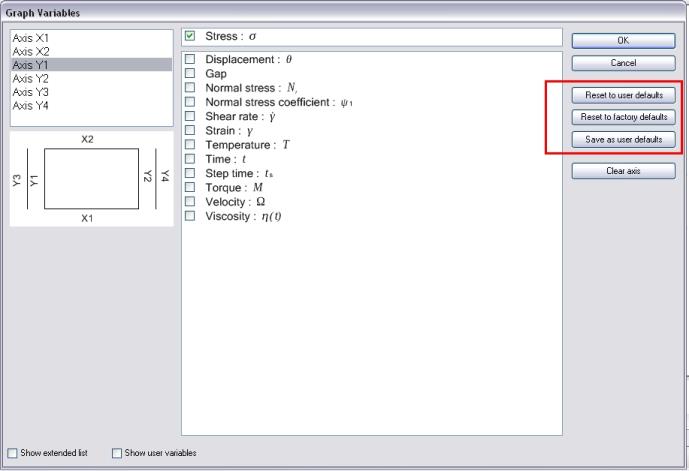
- Variable settings are saved and reset in the Graph Variables (Edit > Variables; see image below) and/or Spreadsheet Variables (Edit > Format) dialog box.
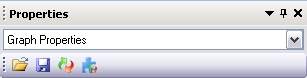
- Presentation settings are saved and reset from the Presentation toolbar (shown below) in the Curves tab on the Ribbon.

- Variables and presentations can also be saved and reset from the Graph or Spreadsheet's Properties panel, where it is also possible to reset selected objects to their factory default setting, and to reset all properties (variables and presentation) to factory default.
- It is important to note that how the opened file is displayed depends upon the status of the Load view settings checkbox in Options > User:
- If the selection is checked, the file is displayed exactly how it looked when it was last saved, even if it was saved by a different user or on a different controller.
- If the selection is unchecked, the file is displayed using the current display properties.
Back to top
